About this site
This site hosts charts and visual outputs generated from the
UK Socio-Economic Modelling project.
They are part of an ongoing attempt to make complex social,
economic, and political systems more legible — not to provide
definitive answers or forecasts.
What you're looking at
The charts published here are generated directly from analytical
models and exploratory data work.
They are intended to:
- illustrate patterns and trends,
- highlight structural dynamics,
- and support discussion rather than close it down.
Some charts relate directly to published blog posts.
Others exist to explore a question or test an idea.
What this isn't
These visuals are not:
- official statistics,
- policy recommendations,
- or finished research outputs.
They are working artefacts from an evolving project.
Uncertainty, revision, and iteration are part of the process.
Where the context lives
If you're looking for explanation, narrative, or motivation,
you'll find that on the accompanying blog:
🔗 https://hysnapsmusicandmentalhealth.wordpress.com/
The underlying code, data, and modelling logic live on GitHub:
🔗 https://github.com/Golder-Development/UK_Socio_Economic_Modelling
A note on interpretation
Complex systems rarely behave neatly.
Patterns often emerge without clear intent.
Outcomes can feel familiar even when the context changes.
These charts are an invitation to think about why that might be.
If something raises questions rather than answers — that's usually
the point.
Generated Charts
Explore the published outputs hosted via GitHub Pages:
Cabinet & Political Analysis
Cabinet Churn & Tenure Report (Interactive HTML):
View Chart
Analysis of senior Cabinet position turnover and tenure length across parliaments (1966 onwards). Combines churn rate trends with tenure distribution data by parliament, including media era markers.
Individual Cabinet Analysis (Interactive HTML):
View Chart
Detailed analysis of individual cabinet members' tenure patterns, career trajectories, and categorization by stability and longevity.
Cabinet Ministers Tenure by Parliament (Interactive HTML):
View Chart
Scatter plot visualization of Cabinet ministers' tenure versus parliament duration.
Election & Pension Analysis
Election Pension Theory Analysis (Interactive HTML):
View Chart
Comprehensive analysis of cabinet appointments around parliamentary elections, investigating whether governments increase appointments and shorten tenures near elections to qualify more members for cabinet pensions.
Final Year Pension Analysis (Interactive HTML):
View Chart
Focused analysis of cabinet appointment patterns in the final year before elections, examining potential pension qualification strategies.
Pension Reform Impact Analysis (Interactive HTML):
View Chart
Analysis of how the 2015 pension reform affected pre-election cabinet turnover patterns, comparing generous defined benefit pensions (pre-2015) with defined contribution schemes (post-2015).
Mortality Dashboards
Mortality Dashboard Age Group By Sex:
View Dashboard
Mortality trends broken down by age group and sex.
Mortality Dashboard Age Groups:
View Dashboard
Overview of mortality patterns across different age groups.
Mortality Dashboard — Old OAPs (85+):
View Dashboard
Mortality analysis for elderly population (85+).
Mortality Dashboard — Older Adults (35–64):
View Dashboard
Mortality trends for older adults aged 35–64.
Mortality Dashboard — Preschool (≤5):
View Dashboard
Mortality analysis for preschool-age children (≤5 years).
Mortality Dashboard — School Age (6–19):
View Dashboard
Mortality trends for school-age children (6–19).
Mortality Dashboard — Young Adults (20–34):
View Dashboard
Mortality analysis for young adults (20–34).
Mortality Dashboard — Young OAPs (65–84):
View Dashboard
Mortality trends for younger elderly (65–84).
Mortality Dashboard By Age Group:
View Dashboard
Comparative mortality visualization across all age groups.
Mortality Dashboard — Drilldown:
View Dashboard
Interactive drilldown dashboard for exploring mortality data in detail.
Mortality Dashboard — Filtered:
View Dashboard
Filtered mortality dashboard with customizable parameters.
Mortality Dashboard — Interactive:
View Dashboard
Full interactive mortality exploration dashboard.
Political Visualization
Political Posts Mind Map — 2D:
View Visualization
Network visualization of UK political posts in 2D.
Political Posts Mind Map — 3D:
View Visualization
Network visualization of UK political posts in 3D.
Political Donations Analysis
Political Donations - Party Comparison Dashboard:
View Dashboard
Interactive dashboard comparing donation patterns across all major UK political parties with time series, donor concentration, and type breakdowns.
Political Donations - Donor Type Analysis:
View Analysis
Analysis of donation types (Cash, Non-Cash, Sponsorship, Public Funds, Bequests) with trends and party distributions.
Political Donations - Temporal Analysis:
View Analysis
Monthly donation trends and donor activity patterns over time.
Political Donations - Party Comparison Heatmap:
View Heatmap
Normalized metrics heatmap comparing parties across key donation dimensions.
Conservative Party Donations:
View Analysis
Detailed donation analysis for the Conservative and Unionist Party.
Labour Party Donations:
View Analysis
Detailed donation analysis for the Labour Party.
Liberal Democrats Donations:
View Analysis
Detailed donation analysis for the Liberal Democrats.
Demographic & Economic Analysis
Lords Membership By Type (1958–Present) (PNG):
View Image
Historical composition of the House of Lords by membership type.
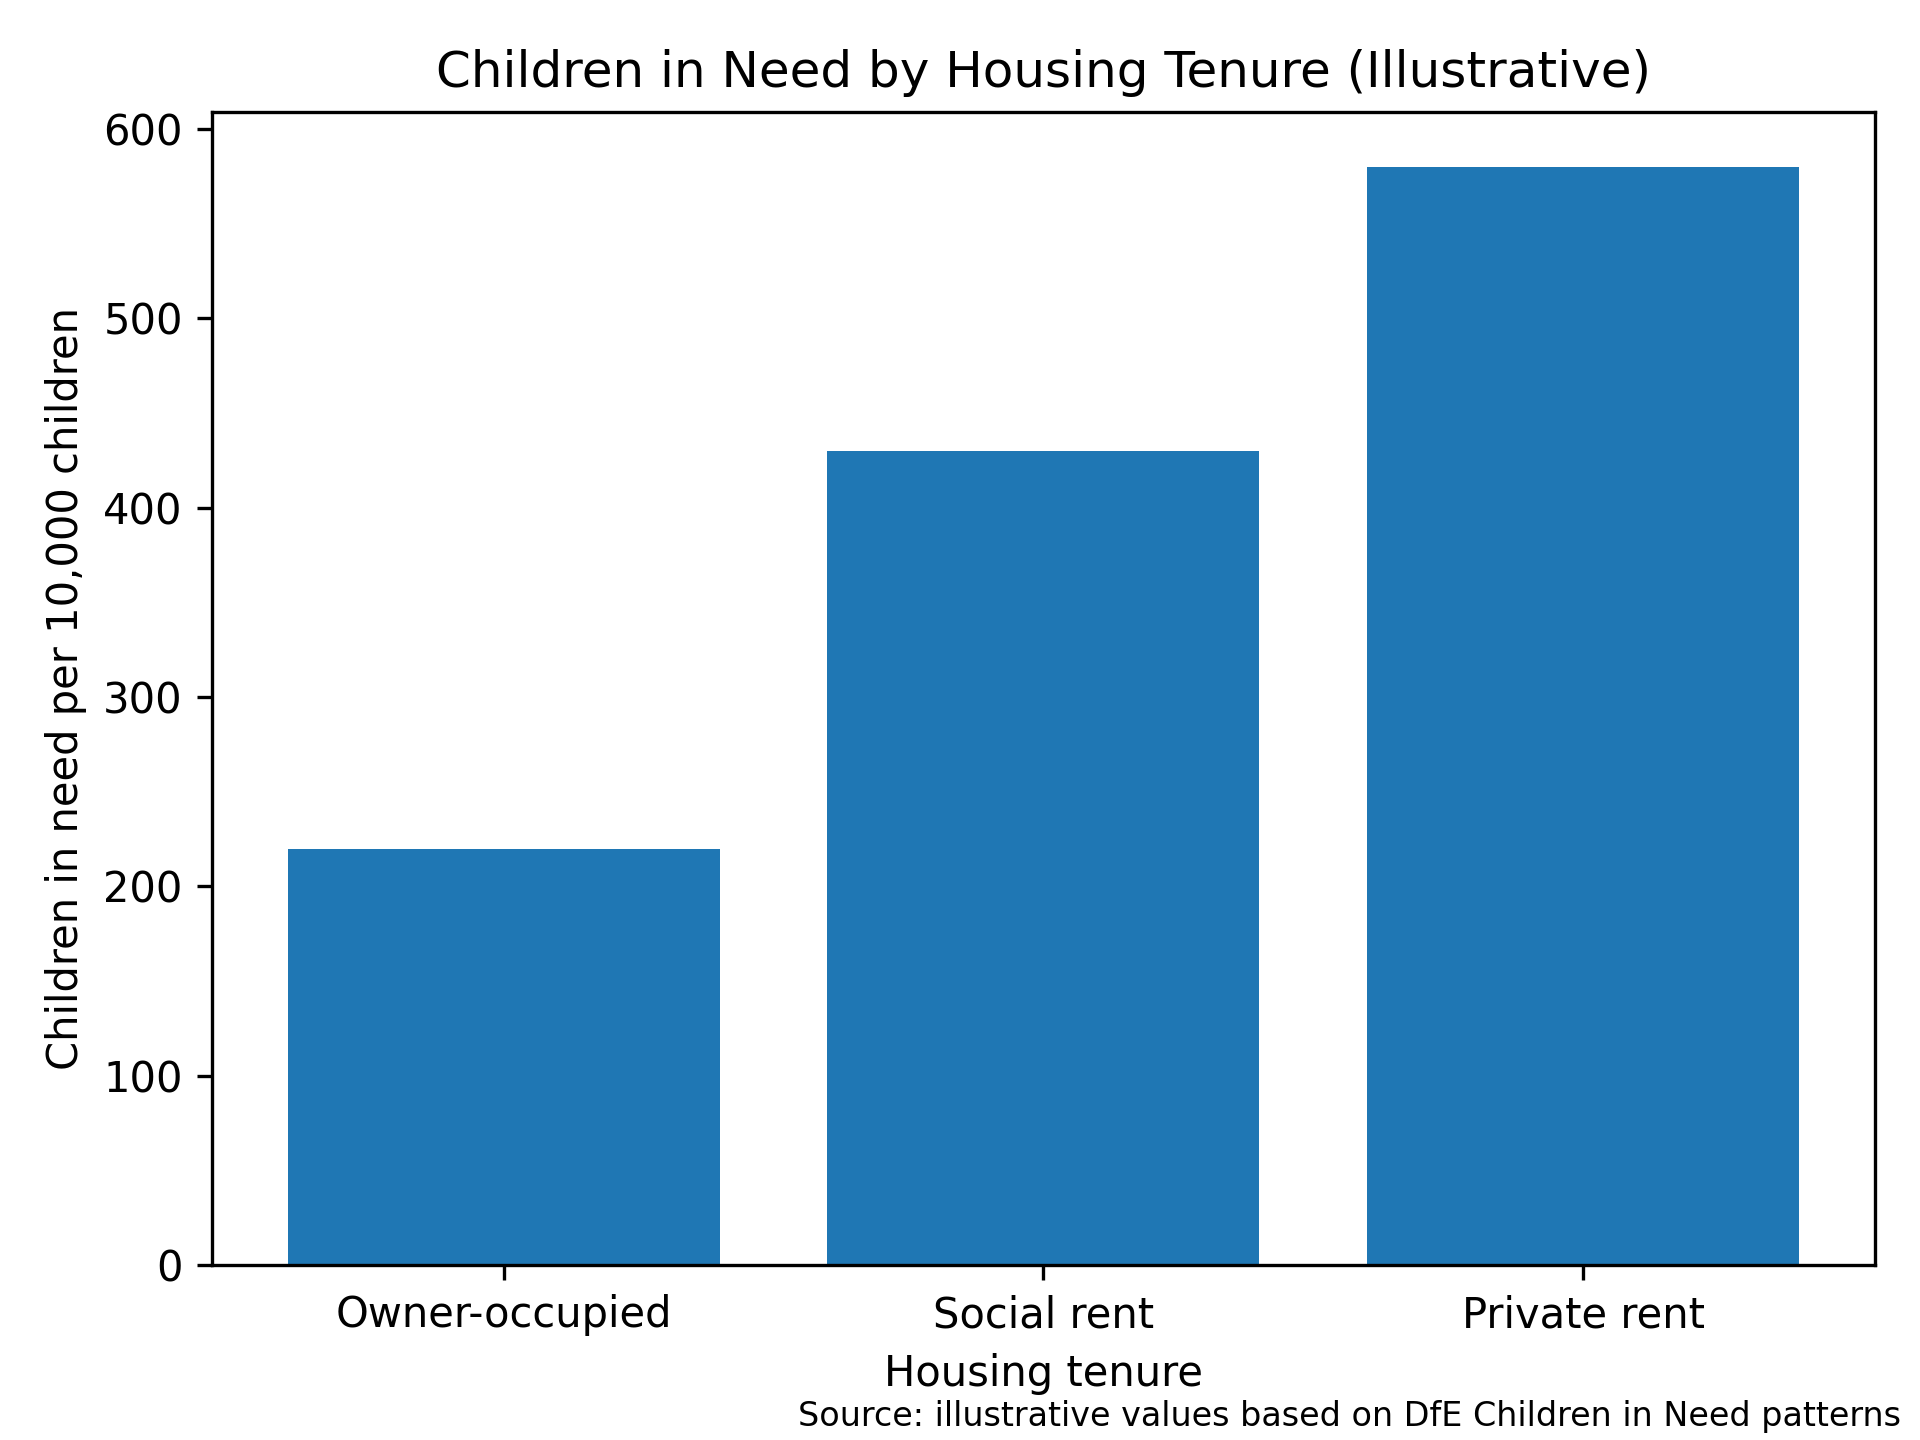
Child Intervention by Tenure (PNG):
View Image
Analysis of child intervention outcomes relative to tenure length.
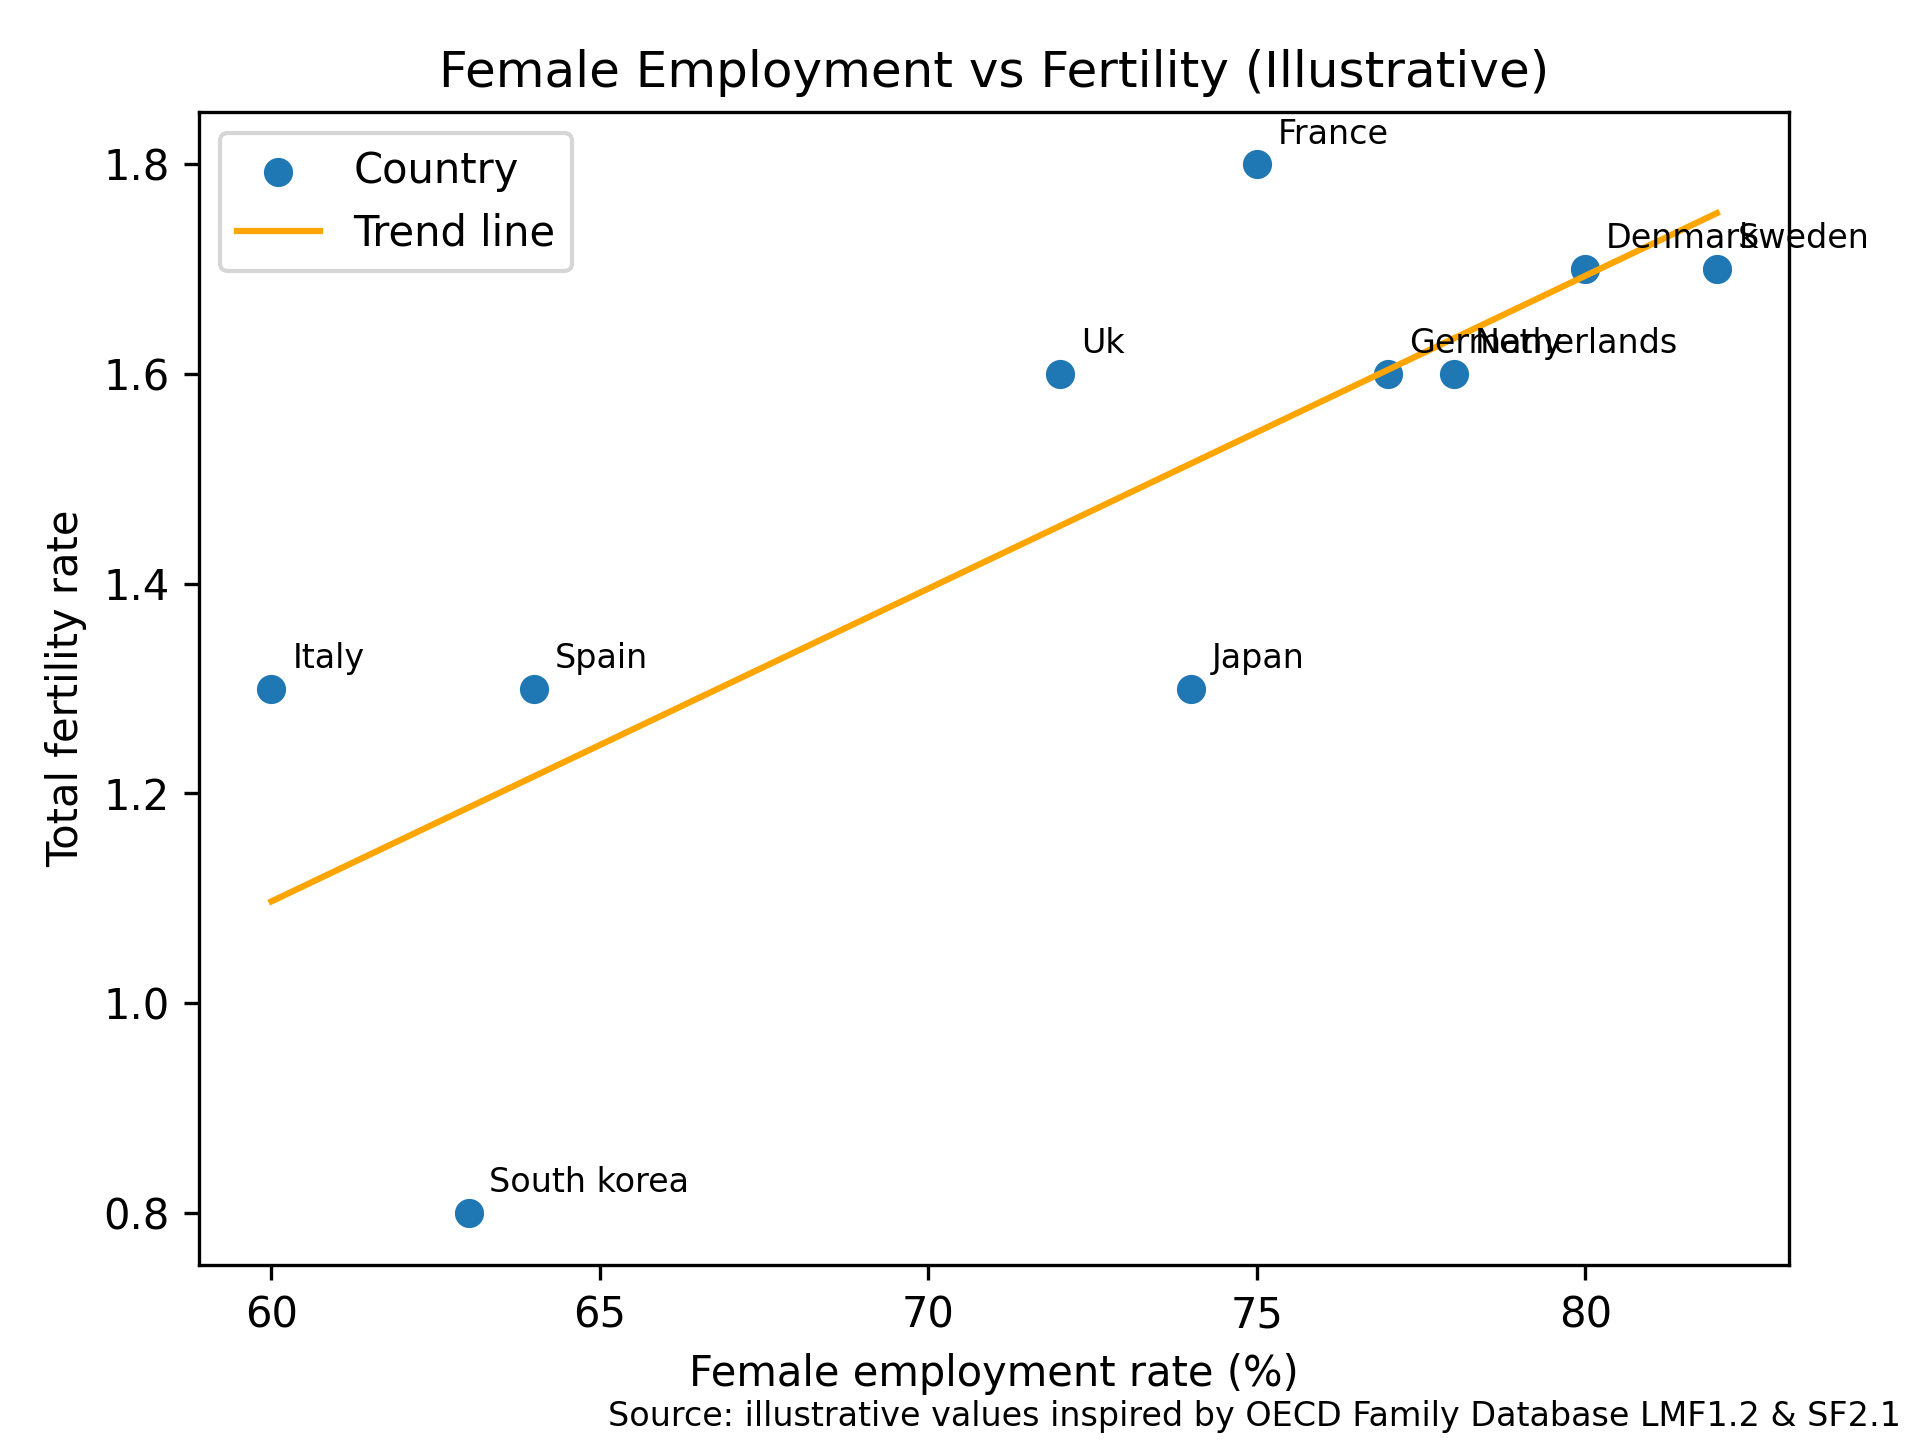
Female Employment vs. Fertility (PNG):
View Image
Correlation analysis between female employment rates and fertility.
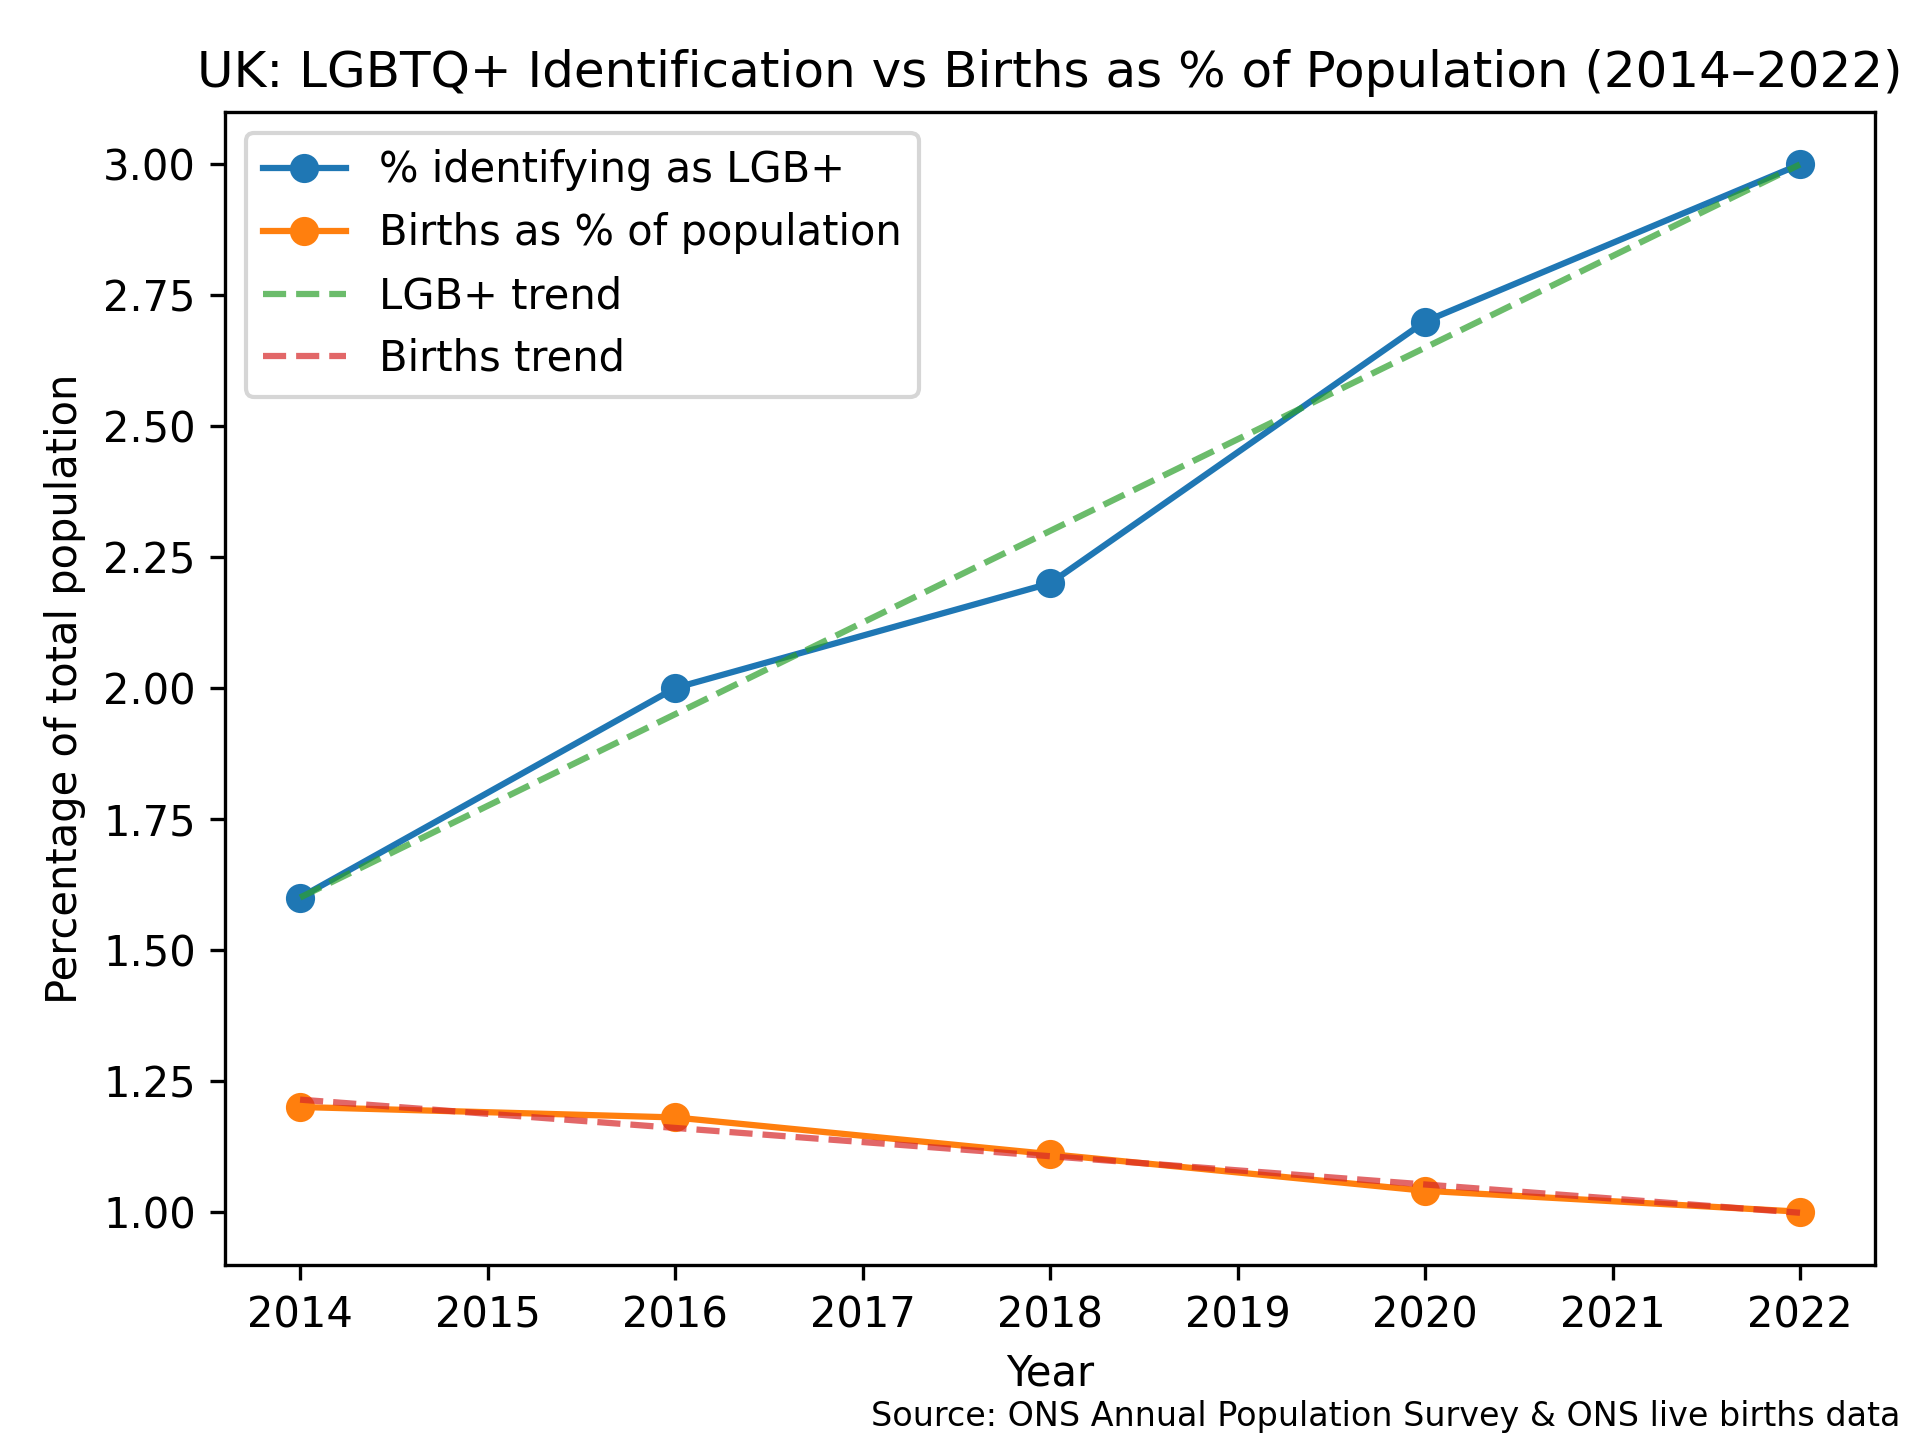
LGBTQ+ Population vs. Births (PNG):
View Image
Relationship between LGBTQ+ population identification and birth rates.
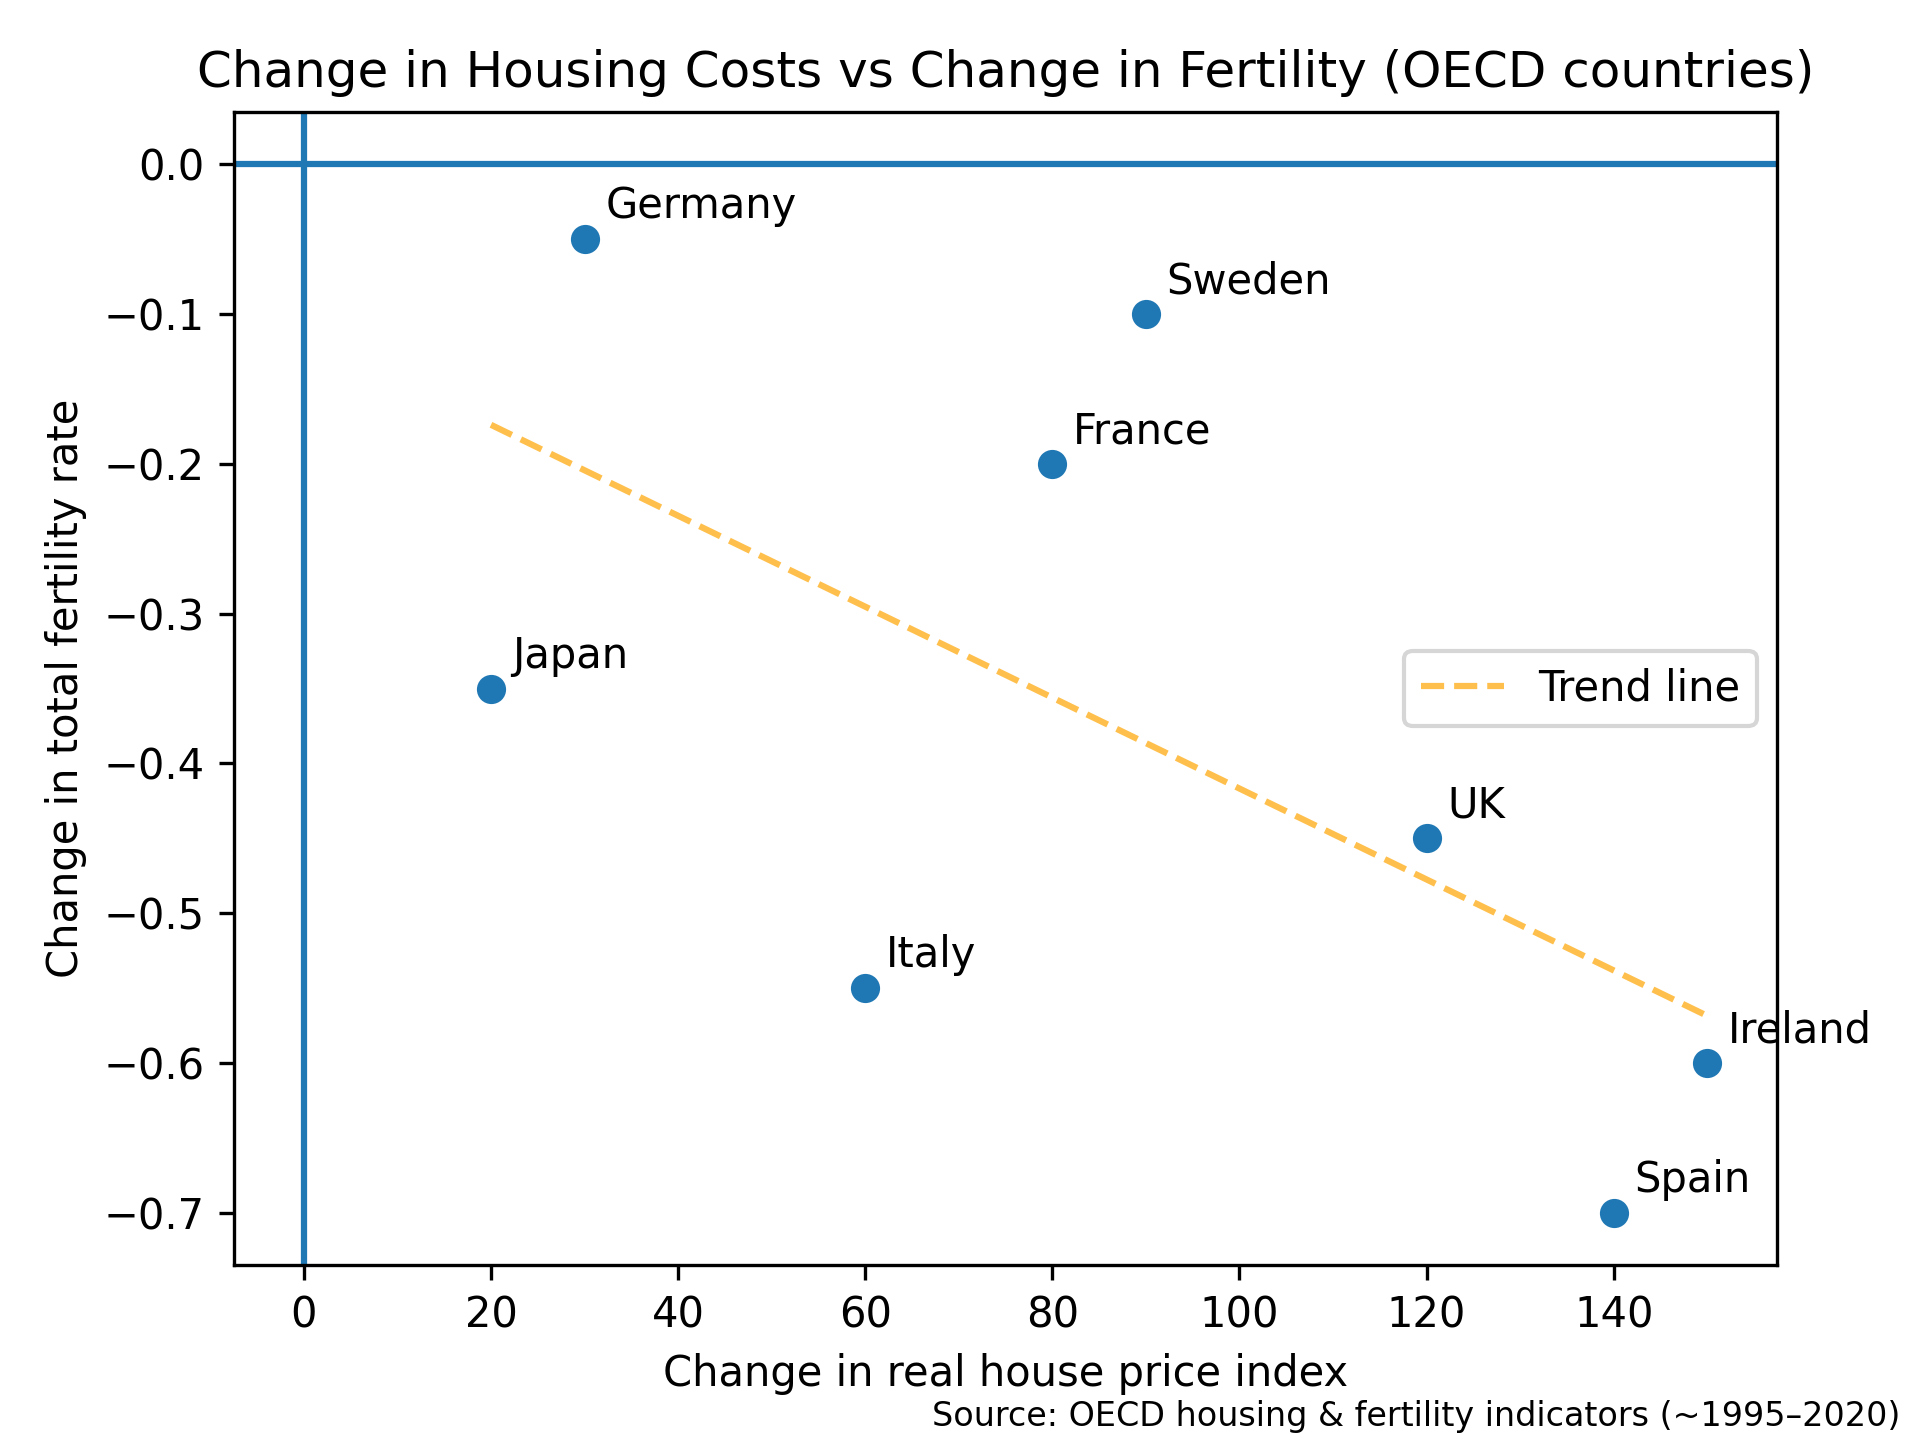
Change in Cost of Housing vs. Change in Fertility (PNG):
View Image
Analysis of housing cost inflation impact on fertility trends.
Data Exports
Cabinet & Political Data
Cabinet Members Tenure Profile (CSV):
Download CSV
Detailed individual statistics for cabinet members including tenure patterns and career metrics.
Appointments Detail (CSV):
Download CSV
Detailed record of cabinet appointments with timing relative to elections.
Election Cycle Analysis (CSV):
Download CSV
Analysis of appointment patterns across election cycles.
Months to Election Analysis (CSV):
Download CSV
Breakdown of appointments by proximity to election dates.
Per Election Analysis (CSV):
Download CSV
Per-election statistics on appointments and patterns.
Parliamentary Phase Analysis (CSV):
Download CSV
Analysis of appointments by parliamentary phase/quarter.
Final Year Analysis (CSV):
Download CSV
Data on cabinet appointments in final year before elections.
Pension Reform Comparison (CSV):
Download CSV
Comparison of appointment patterns pre and post 2015 pension reform.
Mortality Data
ICD Code Summary (CSV):
Download CSV
Summary of ICD-10 medical classification codes.